The Renter Trap - Pay More, Own Nothing, Repeat Forever
The Renter Trap - Pay More, Own Nothing, Repeat Forever
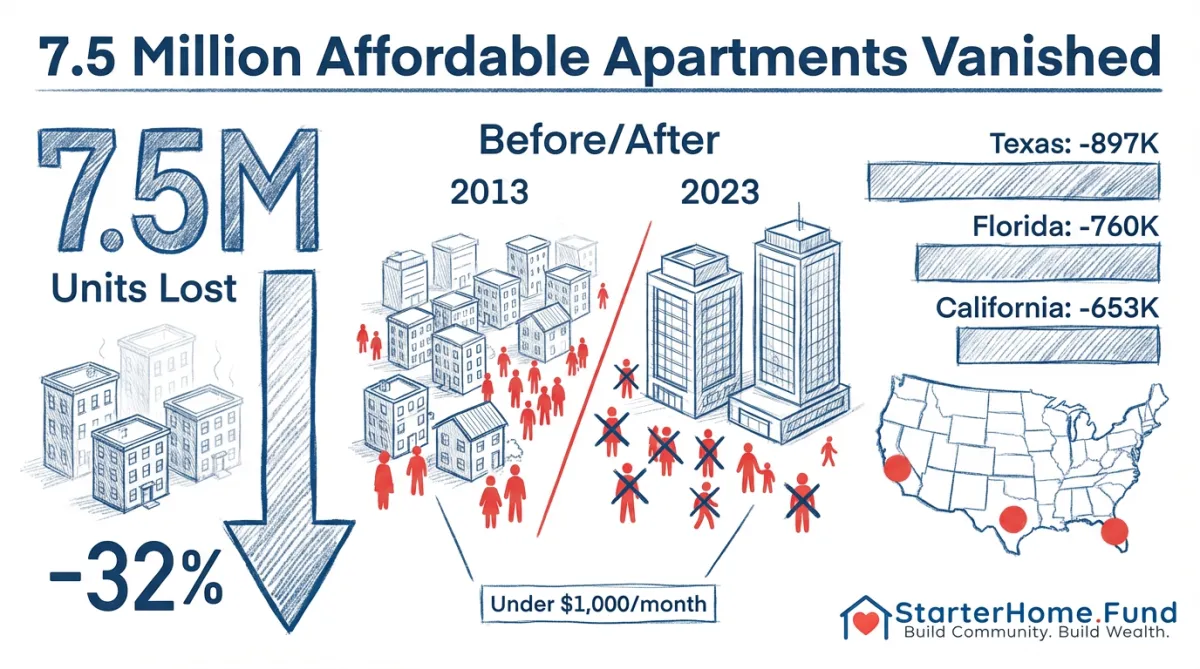
7.5 million affordable rentals gone. Prices requiring $100K+ incomes. The American renter is caught in a wealth-destruction cycle with no exit.
The Trap is Set
Here's the nightmare scenario playing out across America:
You can't afford to buy because homes now require a $103K income (and you earn $75K).
You can't find affordable rent because 7.5 million units under $1,000/month vanished in the last decade.
You're spending 40%+ of your income on rent because the market knows you have no alternatives.
And while you pour money into rent every month, building zero equity, watching your savings stagnate, homeowners are building generational wealth.
Welcome to the Renter Trap.
And it's not an accident. It's a feature of a broken housing market.
The Math That Traps You
Let's walk through what's actually happening:
Scenario: The Median American Household
Household income: $75,000/year
Income needed to buy median home: $102,739
Gap: $27,739 (you're short by 37%)
So you rent. But here's what happened to affordable rentals:
2013:
9 million units under $600/month
15.7 million units $600-$999/month
Total affordable options: 24.7 million units
2023:
6.5 million units under $600/month (-27.7%)
10.7 million units $600-$999/month (-32.0%)
Total affordable options: 17.2 million units
7.5 million affordable units gone. Demand stayed the same (or grew). Supply dropped by 30%.
What happens when supply drops and demand stays constant?
Prices explode.
The Rent Spiral
You're now competing with millions of other priced-out buyers for the remaining affordable rentals.
That $850 apartment you wanted? It's now $1,450. Take it or leave it.
So you take it. Because you have no choice.
Monthly breakdown:
Rent: $1,450
Utilities: $150
Renter's insurance: $25
Total housing cost: $1,625/month
On a $75K income, that's $6,250/month after taxes.
$1,625 / $6,250 = 26% of take-home income.
"That's not so bad," you think.
Except:
Car payment: $450
Car insurance: $150
Gas: $200
Groceries: $600
Student loans: $300
Health insurance: $250
Phone: $80
Internet: $70
Total monthly expenses: $3,725
Income after expenses: $2,525
Now try to save for a down payment. In a market where you need $82,000 down (20% of $410K median home price).
At $500/month savings, that's 164 months. Over 13 years.
And that assumes:
You never have an emergency
Home prices don't keep rising
You don't have kids
Your car doesn't break down
You don't have medical expenses
You're not failing. The system is designed to trap you.
While You're Trapped, They're Building Wealth
Let's compare two households, same income, different starting points:
Household A: The Renter
Pays $1,450/month rent
After 10 years: $174,000 paid in rent
Equity built: $0
Net worth from housing: -$174,000
Household B: The Homeowner (bought before prices exploded)
Pays $1,450/month mortgage
After 10 years: $174,000 paid
Equity built: ~$100K+ (from appreciation + principal paydown)
Net worth from housing: +$100,000
Same monthly payment. $274,000 wealth gap.
This isn't about personal responsibility. It's about when you were born and whether you got into the market before it broke.
The Geographic Lottery
Where you live determines whether you're trapped or free:
States where the trap is tightest (highest % loss of affordable rentals):
Nevada: 47.7% loss
Idaho: 47.7% loss
Montana: 46.4% loss
Arizona: 44.7% loss
Texas: 42.5% loss
Markets where buying is impossible (income required vs. median income):
San Jose: Need $595K, median earns $140K (-$455K gap)
San Francisco: Need $393K, median earns $125K (-$268K gap)
San Diego: Need $307K, median earns $92K (-$215K gap)
If you're a renter in these markets, there is no exit without leaving entirely.
The Investor's Dilemma (And Opportunity)
Here's where it gets interesting.
Everyone knows renters are trapped. So landlords keep raising rents because what else are you going to do?
But here's what most landlords miss:
Trapped renters are angry renters.
They're politically active. They vote for rent control. They push for tenant protections. They create regulatory risk for traditional landlords.
And at some point, the tension breaks.
But what if there was a different model?
The Exit Door: Ownership That Actually Works
What if, instead of trapping renters forever, you gave them a path to ownership that doesn't require a $103K income?
That's the ROC (Resident Owned Community) model.
How it works:
Acquire distressed multifamily at $40K-$60K/door
Convert to resident ownership structure
Residents gain equity shares in the building
Rents stay affordable (or become equity payments)
Property stabilizes with zero tenant turnover
Investor exits at $150-$200/door
Everyone wins:
Residents escape the rent trap and build equity
Community preserves affordable housing
Investors earn 18% AAR
You're not exploiting the trap. You're opening the exit door.
The Numbers Behind the Model
Let's use real numbers from a recent conversion:
Property: 97-unit multifamily in foreclosure
Acquisition: $3M ($40K/door)
Conversion to ROC
Stabilized value: $17M ($175/door conservative)
Returns:
Acquisition to exit: 18 months
ROC members: Gained equity ownership
Community: Preserved 97 affordable units
Investor: 18% AAR
While everyone else is squeezing trapped renters for maximum rent, you're creating a better system and earning institutional returns.
The Bottom Line
The Renter Trap is real. 7.5 million affordable units gone. Median home requiring $103K income. Price-to-income ratios at 5.7x.
The trap is structural. The opportunity is massive.
Traditional landlords see trapped tenants and raise rents.
We see trapped tenants and offer ownership.
One creates regulatory backlash and political risk.
The other creates stable communities and exceptional returns.
👉 Stop exploiting the trap. Build the exit. Join our investor club.
Earn 18% AAR While Creating Pathways to Ownership →
Data Source: Harvard Joint Center for Housing Studies, State of the Nation's Housing 2025